
最近终于确定了日志收集和服务器监控的相关方案
Zabbix作为一款企业级的服务器监控方案,能够满足我们的大部分需求
本文会持续更新使用总结
安装
Zabbix分为agent和server两个部分,我分别把他们部署在production和dev服务器上
Ubuntu的安装相对简单
Zabbix 2.4 for Ubuntu 14.04 LTS:
# wget http://repo.zabbix.com/zabbix/2.4/ubuntu/pool/main/z/zabbix-release/zabbix-release_2.4-1+trusty_all.deb
# dpkg -i zabbix-release_2.4-1+trusty_all.deb
# apt-get update
Example for Zabbix server and web frontend with mysql database.
官网的例子
# apt-get install zabbix-server-mysql zabbix-frontend-php
我的推荐
# apt-get install zabbix-server-mysql
因为zabbix-frontend-php会自动安装apache2,然后如果apache2因为端口已经被占用起不来,删掉的时候也特别烦
zabbix的前端推荐从src下载源码,在frontend-php这个目录下
http://sourceforge.net/projects/zabbix/files/ZABBIX%20Latest%20Stable/2.4.3/zabbix-2.4.3.tar.gz/download
agent端安装
Example for installing Zabbix agent only.
# apt-get install zabbix-agent
配置
agent配置:
### Option: Server
#	List of comma delimited IP addresses (or hostnames) of Zabbix servers.
#	Incoming connections will be accepted only from the hosts listed here.
#	If IPv6 support is enabled then '127.0.0.1', '::127.0.0.1', '::ffff:127.0.0.1' are treated equally.
#
# Mandatory: no
# Default:
# Server=

Server=192.168.1.3

### Option: Hostname
#	Unique, case sensitive hostname.
#	Required for active checks and must match hostname as configured on the server.
#	Value is acquired from HostnameItem if undefined.
#
# Mandatory: no
# Default:
# Hostname=

Hostname=whosv-production-0
这里要注意的是你的hostname和你在控制台注册的名字需要一致,否则会找不到相应的host
服务端配置
按照安装引导配置即可
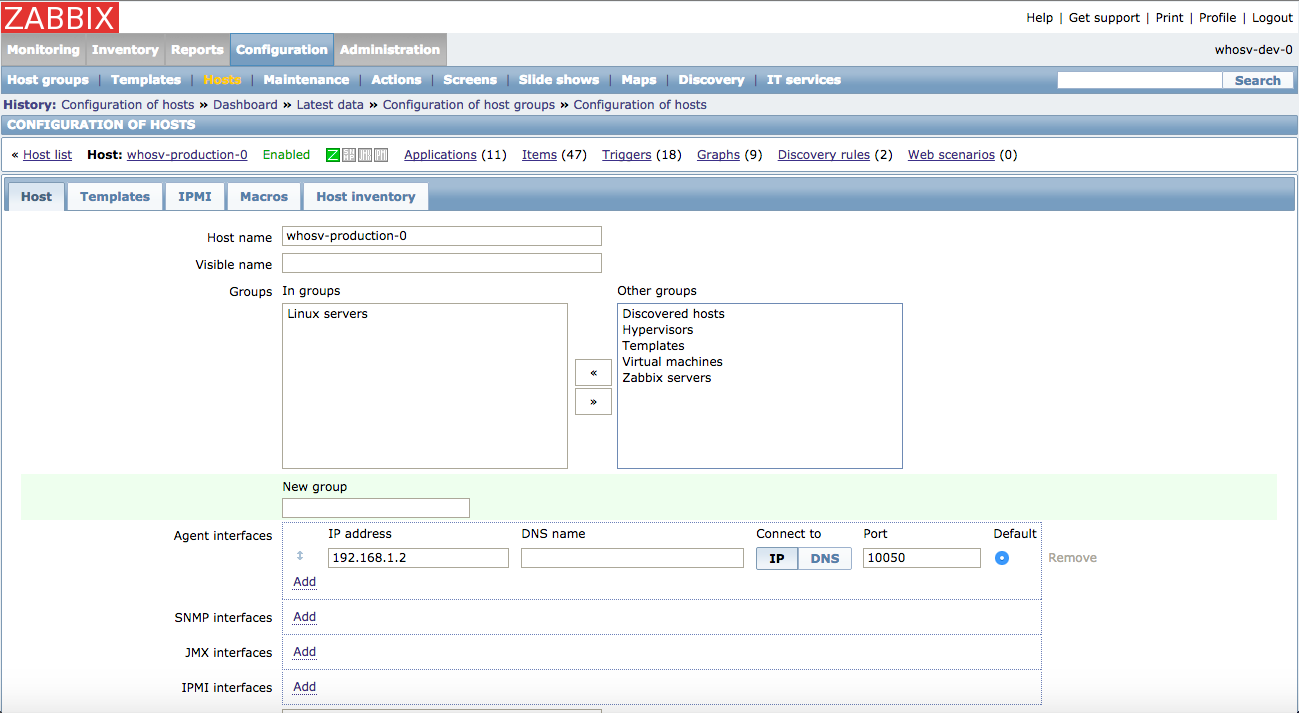
添加host
进到Zabbix的Web控制台,点Configuration下面的Hosts
增加一个host
Hostname必须和之前配置的一样
Group就选择Linux servers就好了
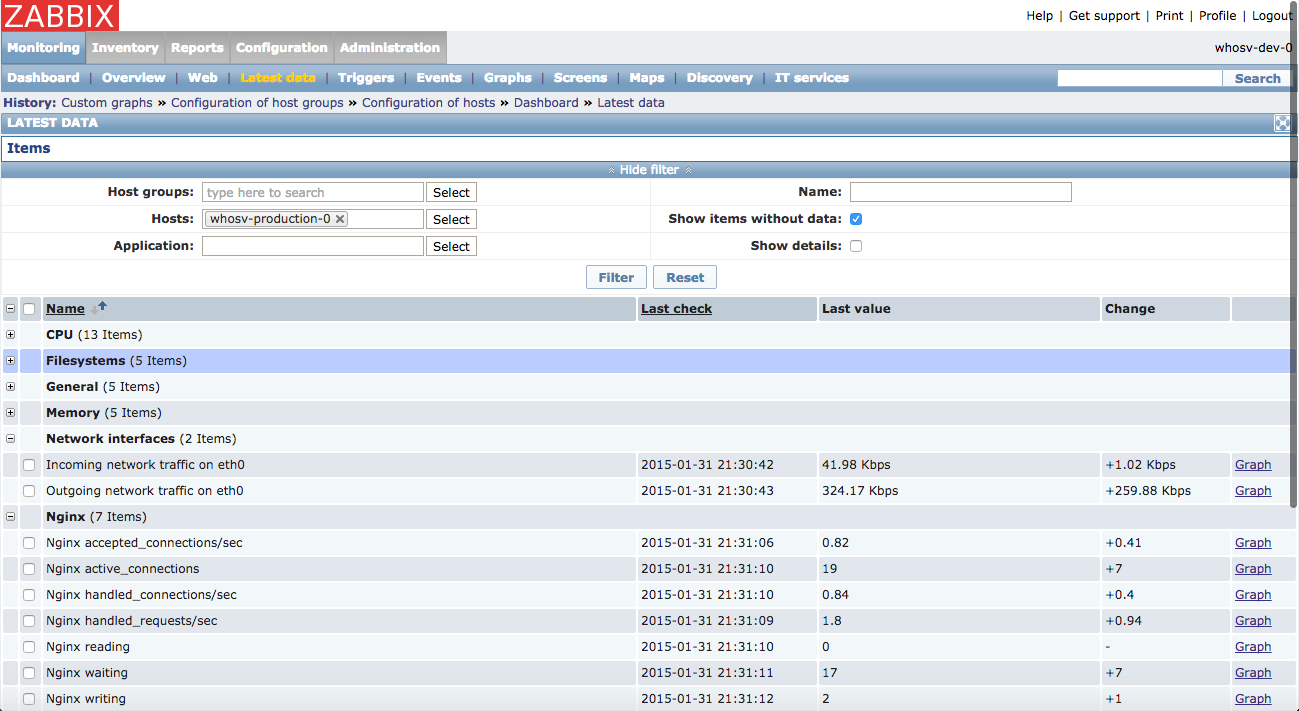
然后你就能在Monitoring的Latest Data下面看到你的监控项目
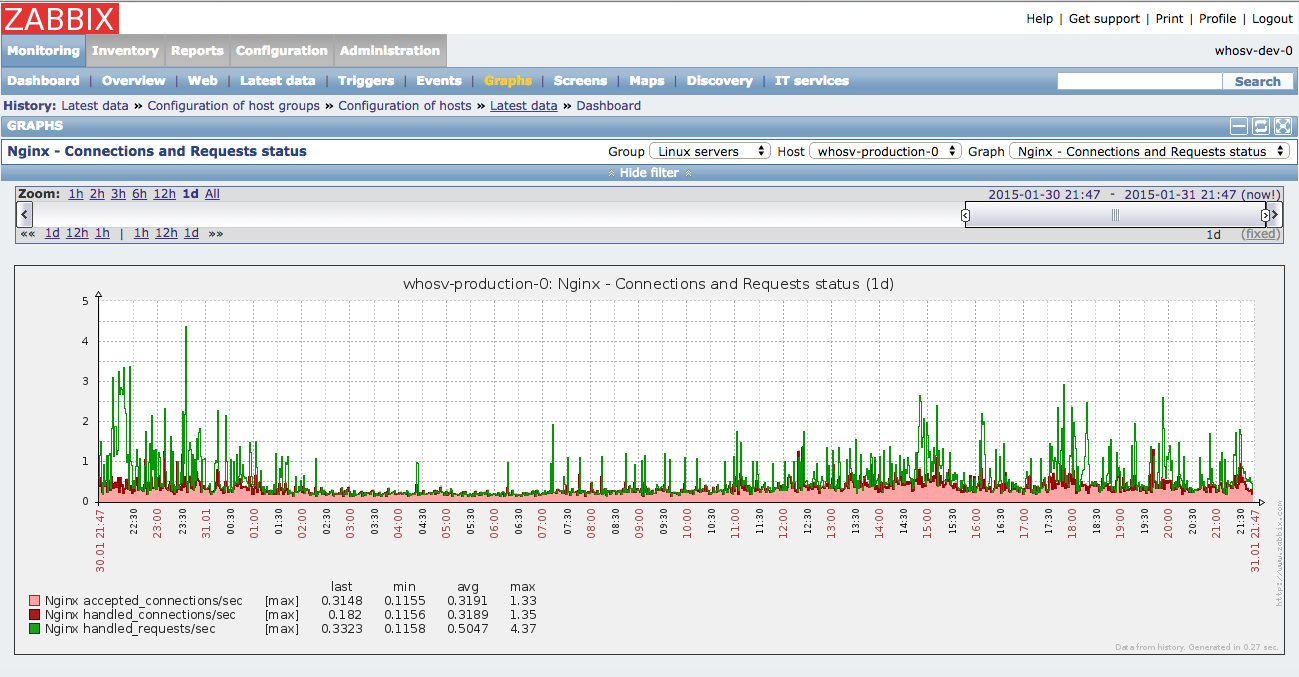
添加Nginx监控
主要参考这个github上面的脚本
但是这个脚本有几个地方不太对
由于nginx的status一般限制为本地访问
用wget -q 命令会permission deny,做如下替换,可能是机制不一样,具体也每太搞清楚
WGET_BIN="/usr/bin/curl"
NGINX_STATS=$($WGET_BIN $URL 2> /dev/null)
然后在控制台导入这个模板,并且给host加上这个模板
最后效果